SiFive Freedom: VC707 program and debug guide
I. Program the board
Remember to switch the switches above the LCD to UP-UP-DOWN-UP-DOWN, then open vivado, open hardware manager, open target board, auto connect.
Vivado direct programming:
- right-click on the xc7vx485t_0
- Program Device ...
- select the .bit file
- Program
Vivado flash programming:
- right-click on the xc7vx485t_0
- Add Configuration Memory Device ...
- select the one with the Alias of 28f00ag18f ---> OK
- OK to continue to program the device
- select the Configuration file (.mcs) and PRM file (.prm)
- select the RS pins: 25:24
- OK to write data to the flash
- finally, right-click again on the xc7vx485t_0 and select Boot from Configuration Memory Device
II. Debug with GDB via JTAG
Using the Olimex JTAG debugger. Reference link: ARM-USB-TINY-H.
II. a) Driver
To install the driver for the debugger:
$ sudo apt-get install libftdi-dev libftdi1
$ sudo vi /etc/udev/rules.d/olimex-arm-usb-tiny-h.rules
Then add this single line in the olimex-arm-usb-tiny-h.rules file:
SUBSYSTEM=="usb", ACTION=="add", ATTRS{idProduct}=="002a", ATTRS{idVendor}=="15ba", MODE="664", GROUP="plugdev"
II. b) Run
You need to prepare your riscv-openocd folder, guide is in Fresh-Ubuntu-setup. Then:
$ cd <your riscv-openocd/ folder>
$ openocd -f riscv-openocd.cfg
If succeed, it will print something like this:
$ openocd -f openocd.cfg
Open On-Chip Debugger 0.10.0+dev-00824-gf93ede540 (2019-11-05-10:20)
Licensed under GNU GPL v2
For bug reports, read
	http://openocd.org/doc/doxygen/bugs.html
Info : auto-selecting first available session transport "jtag". To override use 'transport select <transport>'.
Info : ftdi: if you experience problems at higher adapter clocks, try the command "ftdi_tdo_sample_edge falling"
Info : clock speed 10000 kHz
Info : JTAG tap: riscv.cpu tap/device found: 0x20000913 (mfg: 0x489 (SiFive Inc), part: 0x0000, ver: 0x2)
Info : datacount=2 progbufsize=16
Info : Disabling abstract command reads from CSRs.
Info : Examined RISC-V core; found 4 harts
Info :  hart 0: XLEN=64, misa=0x800000000014112d
Info :  hart 1: XLEN=64, misa=0x800000000014112d
Info :  hart 2: XLEN=64, misa=0x800000000014112d
Info :  hart 3: XLEN=64, misa=0x800000000014112d
Info : Listening on port 3333 for gdb connections
Info : Listening on port 6666 for tcl connections
Info : Listening on port 4444 for telnet connections
Then, open another terminal to start a GDB session: (remember to export the riscv toolchain to your PATH)
$ riscv64-unknown-elf-gdb   #The GDB terminal will appear after this.

From the GDB terminal, type:
$ target extended-remote localhost:3333
If succeed, the CPU will enter the debugging state after this command, and on the GDB terminal you can see the current instruction address.
Some useful tips for debugging the RISC-V CPU:
Run next line:          $ si
Run continue:           $ c
Set breakpoint:         $ hb 0x...
Delete breakpoint:      $ delete
Print cores info:       $ info threads
Select core:            $ thread i    # i is the core number
Set program counter:    $ set $pc=0x...
Print registers table:	$ info registers
Write to address:       $ set *0x...=0x...
Read from address:      $ print/x *0x...
Reset CPU:              $ monitor reset halt
III. Connections
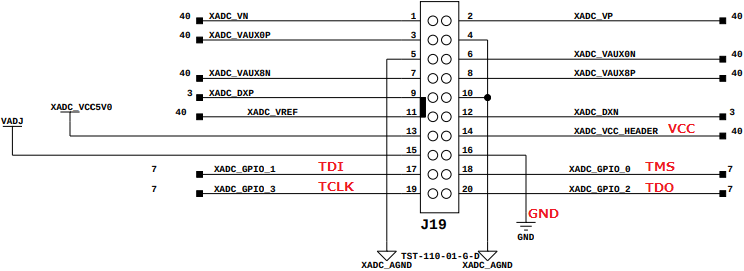
Connect your Olimex JTAG debugger to the VC707 FPGA board by the XADC (J19) header as shown as follows:
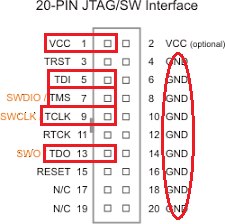
The four data pins TDI (pin 5), TMS (pin 7), TCLK (pin 9), and TDO (pin 13) are connected to the XADC_GPIO 0 to 3 (pin 17 to 20). The VCC (pin 1) is connected to the XADC_VCC_HEADER (pin 14). And any of the GND pin on the JTAG side is connected to the GND pin 16 of the XADC header.
The UART uses the USB-to-UART connection on the board.
The SD-card uses the SD-card slot on the board